Foodservice Labor Scarcity
Foodservice Labor Scarcity – Is there any good news in the numbers?Able-bodied foodservice workers have been so scarce for the past few years that many restaurants have opted to close 2-3 days per week and squeak by with a core employee roster on peak traffic days. That may work where consumer demand varies enough to warrant non-traditional approaches, but institutional operators feeding residents 365 days/year have no such option. They must find people who will show up and do the essential work.
The root of today’s crisis lies in generational demographics. The foodservice industry employs younger, lower-wage workers and would never have grown to its current scale if not for past generations of abundant, cheap labor serving millions of busy people who enjoyed eating food prepared by somebody else. Over half of Americans’ spending for food and beverage occurs away from home, a far greater share than any other nation.
 From 1946 to 1964, 76 million children were born in the US, and by 1965, “baby boomers” comprised 40% of the population. As boomers matured, and especially as women entered the workforce, the economy flourished. Food Away from Home (FAFH) responded with fast food, drive-thru windows, franchising, and endless offerings of inexpensive food. Such growth would not have been possible without a huge supply of young workers earning modest wages. In 1978, nearly 60% of teens aged 16-19 held jobs. By 2000, only 50% of boomers’ kids were active in the workforce. And today only 37% of teens are working (Chart 1), with far fewer to pick from due to sharply lower US population growth.
Chart 1: Teens Age 16-19 Labor Force Participation 1973-2023

Shrinking birth and immigration rates have hampered the foodservice industry for years, but a combination of lower supply (population) and desire to work (participation) on top of baby boomer attrition (retirements) has exacerbated the issue (Chart 2). For employers seeking reliable, modestly compensated workers the picture is painfully bleak.
Chart 2: US Population Growth Rate 1950-Present and Future Projections

The Bureau of Labor Statistics’ (BLS) Employment Cost Index for private industry workers in “Accommodation and Food Service” for the
 latest quarter (June 2023) stood at 181.3 (2005=100), meaning the average foodservice worker earns 81.3% more than 18 years ago. Inflation over the same time was 57%, so foodservice workers are better off. The current index for “All Workers” stands much lower at 161.3, but as recently as 2018, the “All Workers” and “Accommodation and Food Service” indexes were nearly equal at 137. This means real wage gains among foodservice workers have occurred almost entirely in the past few years to the dismay of operators who’ve been forced to contend with rapidly rising wage and turnover rates.
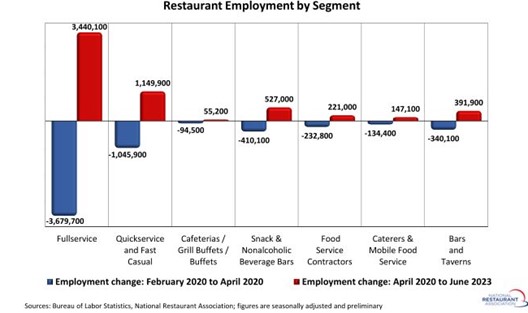
Operators are passing along higher expenses in menu prices as reflected in the BLS’s FAFH Consumer Price Index (currently 7.1% over 2022). Consumers continue to patronize restaurants, but have traded down in search of value, putting increased pressure on labor intensive operations that don’t enjoy the efficiencies of a Taco Bell or McDonald’s. This important discretionary shift is reflected in the BLS’s foodservice employment data recently showing 240,000 fewer Full-service workers in contrast to 104,000 additional Quick service workers since 2020 (Chart 3).
Chart 3

Much blame for the labor malaise has been placed on the COVID-19 pandemic and our government’s response, particularly stimulus payments that played havoc with consumer’s wallets and behaviors. But the underlying structural issues described above were already in place and, if anything, the pandemic served as a catalyst for inevitable change.
For operators in the 365-day business, competing for workers with other industries and higher paying alternatives has always been a challenge, so finding folks that fit the job and enjoy the predictable pace of “institutional work” is a competency sometimes better left to the experts. Contract management firms with organizational depth, HR specialists, and established networks can provide a desperately needed cushion for non-commercial operators struggling to perform vital services.
Good news (perhaps?): There may be some signs of cooling. Job openings across all employment sectors have declined to 9.5 million while the number of people seeking jobs has stabilized around 6.5 million, a much smaller gap than existed a year ago (chart 4). Anecdotally, operators report that the employee crisis has gone from “acute” to “bad-but-tolerable,” the latter of which partly reflects their having adjusted expectations and grown accustomed to a new reality.
Chart 4

Source: BLS; Chart: WSJ
 With recruitment pressure gradually declining, slower wage growth might allow the foodservice industry to seek a new equilibrium, albeit one with permanently elevated costs and margin pressures. It’s also possible higher wages alongside inflated living costs might help the industry attract candidates from the 37% of working age Americans not seeking employment outside the home, as they comprise by far the largest pool of candidates. To be fair, however, none of these hopeful scenarios can or will return us to a bygone era of abundant, low-cost labor. Staffing “always open” foodservice operations will almost certainly remain difficult for many years to come.